10 Essential Agile Estimation Techniques to Master in 2025
In the fast-paced world of software development, accurate forecasting is the difference between on-time delivery and project chaos. But how do you estimate complex, innovative work without a crystal ball? The answer lies in mastering the right agile estimation techniques. Far from being simple guesswork, these methods provide a structured framework for teams to build a shared understanding of effort, risk, and complexity, transforming ambiguity into actionable data.
This guide moves beyond vague theories to offer a practical, in-depth roundup of 10 essential techniques. We will explore everything from the consensus-driven Planning Poker to the rapid, visual approach of Affinity Estimation, providing you with the tools to choose the perfect method for any situation. Understanding how these specific techniques integrate into a larger strategy is crucial; for a complete picture, exploring the foundational principles of agile project planning provides the context needed to apply these methods effectively.
Each technique covered here comes with a detailed breakdown of its mechanics, ideal use cases, and both the advantages and potential drawbacks. Whether you're a product manager refining a backlog, a CTO planning a sprint, or a startup team roadmapping an entire year, this list is your playbook for turning project uncertainty into a competitive advantage. Let's dive in and transform how your team sees, and sizes, the future of your work.
1. Planning Poker
Planning Poker is one of the most widely used agile estimation techniques, transforming the often-tense process of estimation into a collaborative, consensus-driven exercise. Popularized by Mike Cohn and broadly adopted within the Scrum community, this gamified method leverages the collective wisdom of the entire development team to produce more accurate and reliable estimates for user stories or tasks.
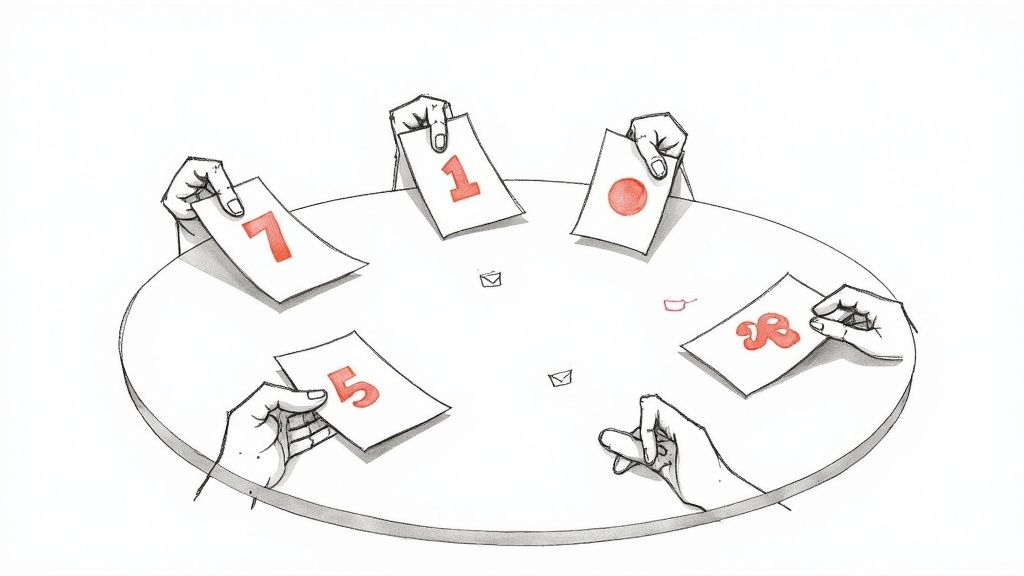
The process is straightforward: after a product owner explains a work item, each team member privately selects a card from a deck that represents their estimate of the effort required. These cards typically follow a modified Fibonacci sequence (0, 1, 2, 3, 5, 8, 13, etc.) to reflect the inherent uncertainty in larger tasks. Everyone reveals their card simultaneously, preventing the "anchoring bias" where one person's estimate influences the group.
How It Works and Why It's Effective
If all estimates are the same or very close, that number is assigned to the item. If the estimates diverge significantly, the team members with the highest and lowest estimates explain their reasoning. This discussion uncovers hidden assumptions, potential risks, and overlooked complexities. After the discussion, the team re-votes, repeating the process until a consensus is reached.
This technique is highly effective because it:
- Encourages participation from all team members, ensuring diverse perspectives are considered.
- Fosters shared understanding and ownership of the work item.
- Exposes knowledge gaps and ambiguities early in the process.
Key Insight: The true value of Planning Poker isn't just the final number; it's the rich conversation that happens when estimates differ. This dialogue is where teams align on scope and approach.
Actionable Tips for Implementation
To get the most out of Planning Poker, consider these practical tips:
- Use a neutral facilitator: This person guides the discussion without influencing the estimates.
- Set discussion time limits: Keep the momentum going by time-boxing the conversation for each item.
- Leverage digital tools: For remote or distributed teams, platforms like Jira, Miro, or dedicated Planning Poker apps work great.
- Focus on outliers: When estimates vary widely, have the highest and lowest estimators explain their rationale first. This quickly surfaces the core of the disagreement.
Tech giants like Google and Microsoft have successfully integrated Planning Poker to improve sprint planning and feature estimation. As a cornerstone of many agile frameworks, it's a powerful tool for any team aiming for more collaborative and accurate forecasting. This technique is a fundamental practice in many agile approaches, and you can learn more about its role in the Scrum methodology to see how it fits into the broader development cycle.
2. T-Shirt Sizing
T-Shirt Sizing is a less formal, relative estimation technique that groups work items into size categories like XS, S, M, L, and XL. Instead of assigning precise numerical values, teams quickly categorize tasks based on their perceived magnitude. This high-level approach is perfect for initial backlog grooming, roadmap planning, and when a quick, coarse-grained estimate is more valuable than a detailed, time-consuming one.

This method simplifies estimation by focusing the conversation on relative effort. A "Large" item is clearly bigger than a "Small" one, but the team doesn't need to debate whether it's exactly three or four times the effort. The process is quick, intuitive, and highly collaborative, making it an excellent entry point for teams new to agile estimation techniques.
How It Works and Why It's Effective
In a T-Shirt Sizing session, the product owner presents a user story or feature, and the team discusses it briefly. Team members then collaboratively decide which size category it fits into. The process is repeated for each item, allowing teams to rapidly sort a large backlog into manageable groups of similar effort.
This technique is highly effective because it:
- Reduces analysis paralysis by avoiding debates over small numerical differences.
- Speeds up the estimation process for large backlogs or early-stage projects.
- Keeps the focus on the big picture and relative scale, not granular details.
Key Insight: T-Shirt Sizing is about creating a shared understanding of magnitude, not a precise commitment. Its speed makes it invaluable for quickly prioritizing large volumes of work and identifying epics that need to be broken down.
Actionable Tips for Implementation
To get the most out of T-Shirt Sizing, consider these practical tips:
- Define reference points: Before starting, agree on what a "Small," "Medium," and "Large" task looks like by choosing well-understood past items as examples.
- Keep sessions brief: Time-box the estimation for a set of items to 15-20 minutes to maintain momentum and focus on high-level assessment.
- Map sizes to story points (optional): For more detailed planning later, you can create a mapping, such as S=3, M=5, L=8, to translate the sizes into a format compatible with sprint planning.
- Use it as a first-pass filter: Employ this technique to get a quick overview of the backlog before using a more granular method like Planning Poker for items scheduled for the next sprint.
Companies like Airbnb and Shopify use T-Shirt Sizing for initial feature estimation and early-stage backlog assessment. Its simplicity and speed make it a go-to method for startups and established companies alike when planning new products or MVPs.
3. Story Points
Story Points are a cornerstone of many agile estimation techniques, providing an abstract unit of measure for the effort required to implement a user story. Instead of estimating in hours or days, which can be misleading, teams assign points based on a combination of factors: the amount of work, its complexity, and any inherent risks or uncertainty. This approach, widely popularized by figures like Mike Cohn and integrated into core Scrum practices, decouples estimation from time and focuses on the relative size of work items.
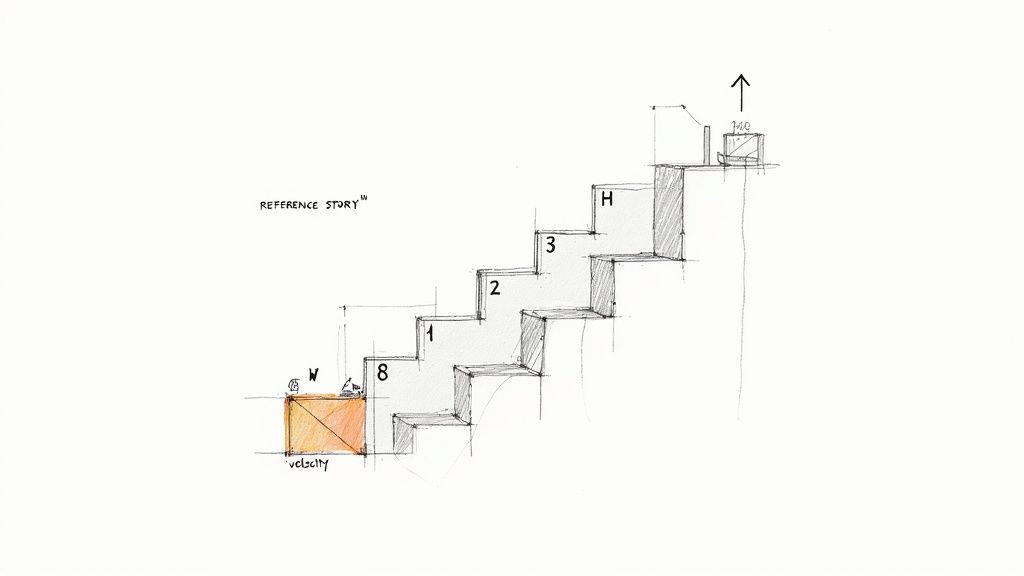
The process typically uses a numerical sequence (like the Fibonacci sequence: 1, 2, 3, 5, 8, 13...) to represent the increasing uncertainty of larger tasks. A team might agree that a simple bug fix is a "2-point" story. They then estimate all other work relative to that baseline. A story estimated at "8" is considered roughly four times the effort of the "2-point" story, not necessarily four times the hours.
How It Works and Why It's Effective
By focusing on relative sizing, Story Points allow teams to estimate quickly without getting bogged down in precise time-based predictions. Over several sprints, a team can calculate its "velocity" - the average number of story points completed per sprint. This historical data becomes a powerful tool for forecasting how much work the team can realistically take on in future sprints, improving long-term planning.
This technique is highly effective because it:
- Removes time-pressure bias and focuses on the magnitude of the work.
- Accounts for complexity and uncertainty, not just development time.
- Enables reliable forecasting through the team's historical velocity.
Key Insight: Story Points are a measure of effort, not a commitment of time. Their power lies in their consistency within a single team, enabling that team to make predictable forecasts based on its own established velocity.
Actionable Tips for Implementation
To implement Story Points successfully, consider these best practices:
- Establish clear reference stories: Define what a 2-point, 5-point, and 8-point story looks like for your team. These serve as a consistent baseline for all future estimations.
- Track velocity over 3-5 sprints: Avoid making forecasts based on a single sprint. A stable average velocity provides a much more reliable planning metric.
- Use points for team forecasting only: Never use Story Points to measure individual productivity or compare different teams, as each team's point scale is unique to them.
- Revisit baseline stories periodically: As a team matures and its skills evolve, the nature of a "5-point" story might change. Re-calibrate your reference points every few months to maintain accuracy.
Companies like Atlassian and Salesforce have successfully scaled their agile delivery using Story Points, proving its effectiveness in coordinating complex work. It remains one of the most fundamental and powerful agile estimation techniques for teams aiming to achieve a predictable and sustainable pace.
4. Three-Point Estimation (PERT)
Three-Point Estimation is a powerful analytical technique that moves beyond single-point estimates to account for uncertainty and risk. Derived from the Program Evaluation and Review Technique (PERT), this method requires the team to consider three distinct scenarios for each work item: the optimistic (best-case), the pessimistic (worst-case), and the most likely outcome. This approach provides a more realistic, risk-weighted estimate.
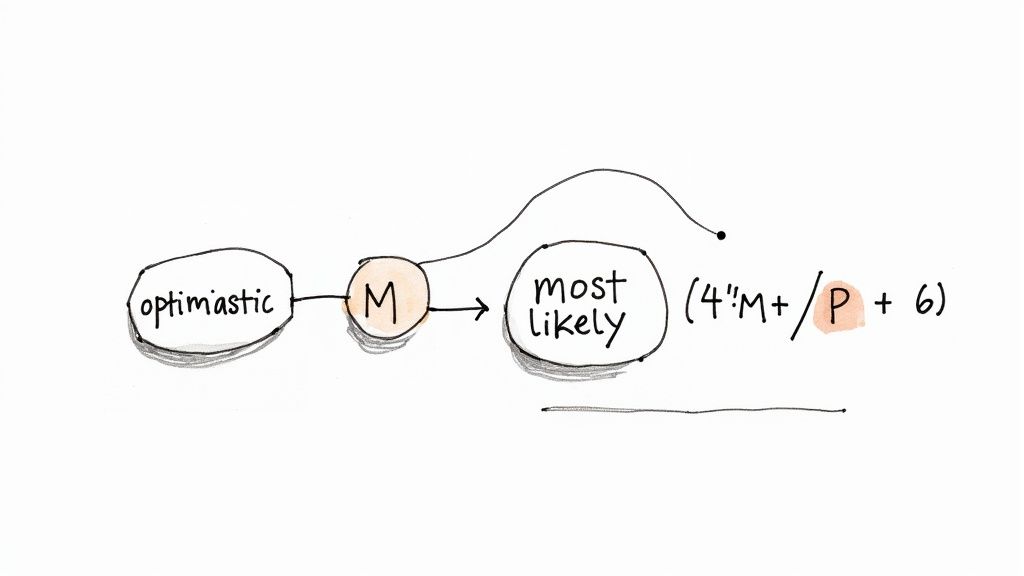
The estimate is calculated using a weighted average, typically the triangular or PERT distribution formula: (Optimistic + 4×Most Likely + Pessimistic) / 6. By giving more weight to the "most likely" scenario while still factoring in potential best and worst cases, the team arrives at an estimate that inherently includes a contingency for unforeseen challenges.
How It Works and Why It's Effective
For a given task, the team first agrees on what "optimistic," "most likely," and "pessimistic" mean. For example, the optimistic estimate is what would happen if everything goes perfectly, while the pessimistic one accounts for potential roadblocks and integration issues. The final calculated number offers a statistically more probable forecast than a single gut-feel guess.
This technique is particularly effective for:
- Mitigating optimism bias by forcing the team to consider what could go wrong.
- Quantifying risk and uncertainty in a simple, structured way.
- Improving stakeholder communication by presenting a range of possible outcomes.
Key Insight: Three-Point Estimation shines when applied to large, complex, or high-risk user stories where a single-point estimate feels insufficient. The discussion about the pessimistic case is often more valuable than the final number itself, as it uncovers hidden risks.
Actionable Tips for Implementation
To implement Three-Point Estimation effectively, try these tips:
- Define clear boundaries: Ensure the team agrees on what optimistic (e.g., 10% chance) and pessimistic (e.g., 90% chance) scenarios represent.
- Use it selectively: Apply this technique to high-risk or large epics, not every small task, to avoid slowing down the estimation process.
- Document assumptions: Record the reasoning behind the pessimistic estimate to inform risk management and sprint planning.
- Calculate the range: Use the difference between the pessimistic and optimistic estimates (P-O) to gauge the level of uncertainty and identify items needing contingency buffers.
Organizations like NASA and many financial services firms use Three-Point Estimation for mission-critical and high-risk projects. As one of several agile estimation techniques, it provides a crucial layer of risk analysis. You can explore how it compares to other methods in this detailed guide to software estimation techniques.
5. Relative Estimation / Comparison
Relative Estimation is an agile estimation technique that shifts the focus from absolute time (like hours or days) to comparative effort. Instead of estimating a work item in isolation, teams compare it to previously completed tasks, asking a simple question: "Is this new item bigger or smaller than that one?" This approach leverages the team's shared experience and historical data to build a more intuitive and often more accurate forecast.
This method avoids the common pitfall of trying to predict the future with perfect accuracy. By comparing new user stories to a known baseline of completed work, teams can quickly place items on a relative scale. This is far more efficient than debating the exact number of hours a task might take, which can be prone to optimism bias and unforeseen complexities.
How It Works and Why It's Effective
The process begins by establishing a few well-understood "reference stories" of varying sizes. When a new item is presented, the team discusses it and places it on the scale relative to these benchmarks. For example, a new task might be deemed "bigger than Story A (3 points) but smaller than Story B (8 points)," leading to an estimate of 5 points.
This technique is highly effective because it:
- Leverages human intuition for comparison, which is often more reliable than abstract calculation.
- Speeds up the estimation process by avoiding lengthy debates over specific hours.
- Creates a consistent sizing model that remains valid even as team velocity changes.
Key Insight: Relative estimation is about understanding the size of work in relation to other work, not its duration. The goal is consistency, not perfect precision, which leads to more predictable long-term planning.
Actionable Tips for Implementation
To successfully implement Relative Estimation / Comparison, consider these tips:
- Establish clear reference stories: Select 2-5 well-documented, completed stories that the whole team understands to serve as your sizing baseline.
- Use a consistent "Definition of Done": Ensure that the work included in one story is comparable to another. An inconsistent scope will undermine your relative comparisons.
- Update baselines periodically: As the team's skills and understanding evolve, revisit and update your reference stories to reflect their current capabilities.
- Ask "Which past work is this most similar to?": Frame the estimation conversation around direct comparisons to historical tasks to ground the discussion in shared experience.
Companies like Spotify and GitHub have used relative estimation to great effect, allowing their engineering squads to size features and improvements consistently against past work. It's a foundational concept in many agile estimation techniques, providing a pragmatic way to forecast effort without getting lost in the details of time-based predictions.
6. Wideband Delphi
Wideband Delphi is a structured, consensus-based estimation technique that refines expert opinion through iterative rounds of anonymous feedback. Developed at the RAND Corporation and popularized by Barry Boehm, it provides a more formal and controlled alternative to methods like Planning Poker, specifically designed to mitigate the effects of groupthink and social pressure. It gathers independent expert opinions and uses a systematic process to move toward a reliable, converged estimate.
The process involves a facilitator who presents a work item to a panel of experts. Each expert privately and anonymously submits an initial estimate. The facilitator then collates these estimates, often displaying them on a chart without revealing who submitted which number, and the team discusses the results, particularly the outliers. This anonymity allows participants to voice their reasoning freely, focusing purely on the technical merits of the arguments rather than on personalities.
How It Works and Why It's Effective
After the initial discussion, the experts re-estimate the work item in another private round. This cycle of estimating, discussing, and re-estimating continues for a few rounds until the estimates converge to an acceptably narrow range. The final estimate is typically a calculated average of the final round's submissions, providing a data-backed consensus.
This technique is highly effective because it:
- Minimizes cognitive biases like anchoring and the halo effect by keeping initial estimates anonymous.
- Leverages a structured process to ensure all assumptions are questioned and documented.
- Produces a well-reasoned estimate backed by a transparent and auditable process.
Key Insight: Wideband Delphi's strength lies in its structured anonymity. It forces a focus on the "why" behind an estimate, ensuring that the final number is the product of reasoned debate rather than social influence.
Actionable Tips for Implementation
To implement Wideband Delphi effectively, consider these practical tips:
- Appoint a skilled facilitator: Their role is critical in managing the process, keeping discussions on track, and ensuring anonymity.
- Clearly define the work: Provide a detailed specification of the task to be estimated to prevent ambiguity.
- Limit the number of rounds: Aim for 2-3 rounds to maintain efficiency and prevent estimation fatigue.
- Document the rationale: During discussions, the facilitator should document the key points raised by high and low estimators to inform subsequent rounds.
Organizations like NASA and various defense contractors have long used Wideband Delphi for critical, high-stakes project estimations where accuracy is paramount. It stands as one of the most rigorous agile estimation techniques, ideal for complex or high-risk work items.
7. Affinity Estimation
Affinity Estimation is a rapid, collaborative technique used for sizing a large number of user stories or backlog items quickly and visually. Instead of debating individual items, team members silently group them by relative size. This method, often employed by Lean and Extreme Programming (XP) teams, is ideal for initial backlog grooming or when a quick, high-level overview of effort is needed without getting bogged down in detailed discussion.
The process is highly intuitive: user stories are written on physical or digital cards. Team members then, without speaking, place these cards on a wall or board, arranging them horizontally from smallest to largest. Items of similar perceived effort are grouped together vertically, forming distinct columns or "buckets" of size. This silent, kinesthetic activity allows for swift, consensus-based sorting.
How It Works and Why It's Effective
Once the silent sorting period ends, the team has a brief discussion about the placement of items, particularly any that were moved back and forth. This conversation clarifies assumptions and resolves disagreements. Finally, the team assigns relative size values (like T-shirt sizes or story points) to each column, instantly estimating a large volume of work.
This technique is highly effective because it:
- Minimizes lengthy debates, making it one of the fastest agile estimation techniques for large backlogs.
- Provides a visual representation of the work, making relative sizing clear and intuitive.
- Leverages collective intuition and gut feeling before diving into detailed analysis.
Key Insight: The power of Affinity Estimation lies in its speed and silence. By removing anchoring bias and prolonged discussion, teams can process dozens of items in minutes, focusing on relative size rather than precise, absolute numbers.
Actionable Tips for Implementation
To get the most out of Affinity Estimation, consider these practical tips:
- Ensure stories are well-written: Team members must be able to quickly understand the core of each item.
- Allow for silent sorting time: Give the team 5-10 minutes to place and arrange items without discussion to avoid influencing each other.
- Assign sizes after grouping: Wait until all items are sorted into columns before assigning point values or T-shirt sizes (XS, S, M, L, XL).
- Leverage digital tools: For remote teams, platforms like Miro or Google Jamboard are excellent for creating a virtual affinity mapping board.
Companies like Atlassian and various Lean startups use this method for large-scale backlog grooming. It's a pragmatic choice when the goal is to get a "good enough" estimate for a large volume of work quickly, often as a precursor to more detailed estimation on high-priority items.
8. Dot Voting / Dot Estimation
Dot Voting, also known as Dot Estimation, is a simple, democratic, and highly visual technique used for rapid decision-making and relative sizing. Often employed in retrospectives, brainstorming sessions, and backlog refinement, it allows a group to quickly converge on priorities or estimates by distributing a limited number of "dots" or votes across various items. This method is particularly effective for gauging collective opinion and identifying the most critical or effort-intensive tasks without getting bogged down in detailed numerical analysis.
The process is intuitive: a list of items (features, user stories, or ideas) is displayed on a board. Each team member receives a set number of dots, which they then place on the items they believe are the most significant. Items that accumulate the most dots are considered higher priority or larger in scope, providing a clear visual representation of the group's consensus.
How It Works and Why It's Effective
After a facilitator presents the items, participants place their dots simultaneously or in turns. They can allocate all their dots to one item or spread them across several, depending on the rules established. This flexibility allows individuals to express the strength of their convictions. The final distribution of dots instantly reveals a prioritized or sized list based on the team’s collective judgment.
This technique is highly effective because it:
- Enables rapid consensus by quickly visualizing where the team’s focus lies.
- Is highly democratic, giving every participant an equal voice in the process.
- Minimizes lengthy debates on less important items, focusing discussion on top contenders.
Key Insight: Dot Voting’s power comes from its simplicity. It bypasses complex calculations, making it an excellent tool for initial prioritization or a quick "gut check" before committing to more granular agile estimation techniques.
Actionable Tips for Implementation
To get the most out of Dot Voting, consider these practical tips:
- Clearly define what a dot represents: Before starting, clarify if dots signify priority, effort, value, or complexity.
- Limit the number of dots: Give each person 5-7 dots. This forces them to make meaningful choices rather than voting for everything.
- Use different colored dots: Assign colors to different dimensions (e.g., green for value, red for risk) to add another layer of insight.
- Discuss the outliers and clusters: Pay attention to items with many dots and those with none. Discussing these can reveal important team perspectives.
Design Thinking sprints and Lean UX workshops frequently use Dot Voting to narrow down ideas, while companies like Spotify have used it in retrospectives to prioritize improvement actions. It's an invaluable tool for any team needing to make quick, collaborative decisions.
9. Bucket System Estimation
Bucket System Estimation is a rapid, high-level agile estimation technique designed for sorting a large number of work items quickly. Instead of assigning a precise story point value to each item, this method groups them into predefined "buckets" or categories that represent a range of effort. It streamlines backlog grooming and is particularly effective for large-scale planning sessions.
This approach is popular in enterprise environments and with teams using frameworks like the Scaled Agile Framework (SAFe) for program increment planning. The goal is to achieve "good enough" sizing quickly, enabling teams to make informed decisions without getting bogged down in detailed debates over every single user story.
How It Works and Why It's Effective
The team defines a set of buckets, each with a size range (e.g., Small: 1-3, Medium: 5-8, Large: 13-20, Epic: 21+). One by one, a facilitator presents a work item, and the team discusses which bucket it best fits into. This comparison-based sorting is faster than assigning individual points and helps maintain a consistent relative scale across the entire backlog.
This technique is highly effective because it:
- Speeds up estimation for large backlogs, making it ideal for quarterly or release planning.
- Reduces analysis paralysis by focusing on magnitude rather than granular precision.
- Simplifies decision-making by grouping similarly sized items together.
Key Insight: The Bucket System thrives on relativity. The focus isn't on whether a story is exactly an 8 or a 13, but on whether it's clearly larger than a 5 and smaller than a 20. This grouping provides enough data for effective forecasting.
Actionable Tips for Implementation
To implement Bucket System Estimation successfully, consider these practical tips:
- Establish clear bucket boundaries: Define 5-7 distinct buckets with non-overlapping ranges (e.g., 1-2, 3-5, 8, 13, 20+). Too many buckets will slow the process down.
- Use reference stories: Assign a well-understood "anchor" story to each bucket to serve as a benchmark for comparison.
- Discuss only the outliers: Only spend time debating items where there is significant disagreement on which bucket it belongs to.
- Keep the process physical or visual: Use columns on a whiteboard or digital board to represent buckets, and have team members physically move story cards.
Consulting firms and product teams at companies like Microsoft have used this method for rapid backlog sizing and project scoping. As one of the most efficient agile estimation techniques for handling volume, the Bucket System is a powerful tool for teams needing to plan at scale without sacrificing clarity.
10. Ideal Hours / Time-Based Estimation
Ideal Hours, also known as Time-Based Estimation, is a technique that asks team members to estimate work based on uninterrupted, focused time. This method, originally prominent in early Extreme Programming (XP) practices, measures effort in "ideal" hours, completely free from meetings, emails, or other daily distractions, rather than actual clock time. It provides a direct, time-based forecast under perfect conditions.
While many modern agile teams have shifted to abstract measures like story points, Ideal Hours remains a valuable technique in specific contexts. It is particularly useful for teams that require precise time tracking for billing, such as consulting firms or government contractors, or for organizations transitioning from traditional project management.
How It Works and Why It's Effective
The process involves team members estimating how many focused hours a task would take if they could work on it without any interruptions. The team must first agree on a shared definition of what an "ideal day" looks like (e.g., six ideal hours within an eight-hour workday). These estimates are then aggregated to forecast project timelines.
This technique can be effective because it:
- Provides a tangible unit of measure (hours) that is easily understood by stakeholders outside the development team.
- Encourages a focus on pure effort, separating the work itself from external delays and overhead.
- Integrates well with time-tracking systems, simplifying reporting for client billing or internal accounting.
Key Insight: The main challenge and strength of Ideal Hours is its distinction from calendar time. A task estimated at four ideal hours will almost always take longer than half a day to complete in reality due to normal workplace interruptions.
Actionable Tips for Implementation
To implement Ideal Hours estimation effectively, consider these practical tips:
- Establish a clear definition: Your team must agree on what constitutes an "ideal hour" and how many exist in a typical workday.
- Track actual vs. estimated: Regularly compare estimated ideal hours against the actual focused time spent on tasks to refine future estimates.
- Use a load factor: Determine a realistic conversion rate (e.g., 1 ideal hour = 1.5-2.0 real hours) to translate estimates into calendar-based deadlines.
- Be wary of pressure: Since hours are a familiar metric, there can be external pressure to reduce estimates without reducing scope. Guard against this to maintain accuracy.
Ideal Hours can be a pragmatic bridge for teams moving toward more abstract agile estimation techniques or a permanent solution for projects with strict time-based reporting needs. Understanding the nuances of this method is a key part of comprehensive software development cost estimation and project planning.
Comparison of 10 Agile Estimation Techniques
| Method | 🔄 Implementation Complexity | ⚡ Speed / Efficiency | 📊 Expected Outcomes | ⭐ Key Advantages | 💡 Ideal Use Cases |
|---|---|---|---|---|---|
| Planning Poker | Moderate — facilitator + synchronized rounds | Moderate — efficient per item, slower with large teams | Consensus-based story points; better shared understanding | Reduces anchoring/groupthink; fosters team alignment ⭐ | Sprint planning, backlog refinement, cross-functional teams 💡 |
| T-Shirt Sizing | Low — simple categorical setup | Very fast — quick first-pass sizing ⚡ | High-level relative sizes for prioritization | Accessible to non-technical stakeholders; reduces analysis paralysis ⭐ | Product discovery, early roadmapping, rapid backlog triage 💡 |
| Story Points | Moderate — requires baselines and discipline 🔄 | Moderate — steady once reference stories exist | Relative sizing enabling velocity tracking and forecasting 📊 | Decouples estimate from time; supports predictability ⭐ | Sprint planning, velocity-based forecasting, cross-functional estimation 💡 |
| Three-Point Estimation (PERT) | High — three estimates + weighted math 🔄 | Slow — time-consuming per item | Weighted estimate with uncertainty range; confidence intervals 📊 | Explicitly accounts for risk and uncertainty; statistically grounded ⭐ | High-risk or complex features, stakeholder risk communication 💡 |
| Relative Estimation / Comparison | Low–Moderate — needs reference items and history | Fast once baselines set | More accurate relative sizes using past work; reduces bias 📊 | Leverages historical data; concrete comparisons improve accuracy ⭐ | Ongoing estimation after baselines established, predictable domains 💡 |
| Wideband Delphi | High — multiple anonymous rounds, trained facilitation 🔄 | Slow — multiple rounds and coordination | Converged expert consensus with documented reasoning 📊 | Minimizes authority/groupthink bias; captures minority views ⭐ | Critical/high-stakes estimates, distributed teams, regulated environments 💡 |
| Affinity Estimation | Low — silent sorting and visual grouping | Very fast — excellent for many items ⚡ | Rapid clustered sizes; visual patterns for backlog organization | Scales to large backlogs; reduces verbal dominance; quick consensus ⭐ | Large backlog grooming, initial release sizing, remote teams 💡 |
| Dot Voting / Dot Estimation | Low — simple voting mechanics | Very fast — quick consensus visualization ⚡ | Immediate visual priorities or perceived sizes; highlights disagreement | Democratic, visual, easy to run with large groups ⭐ | Prioritization, retrospectives, stakeholder feature selection 💡 |
| Bucket System Estimation | Low–Moderate — define buckets, collaborative placement | Fast — quicker than detailed poker ⚡ | Grouped size ranges for many items; reasonably accurate sizing | Balances speed and relative accuracy; good for large lists ⭐ | Large backlog sizing, SAFe PI planning, rapid resource allocation 💡 |
| Ideal Hours / Time-Based Estimation | Low — intuitive but needs definition of "ideal" 🔄 | Moderate — straightforward but calibration needed | Effort estimates in ideal hours; convertible to capacity with factors 📊 | Intuitive for time-tracking/billing contexts; useful for capacity planning ⭐ | Traditional environments, billing, teams needing explicit time estimates 💡 |
Choosing Your Toolkit: From Estimation to Execution
We’ve journeyed through a comprehensive array of agile estimation techniques, from the collaborative consensus of Planning Poker to the broad-stroke efficiency of T-Shirt Sizing. The central takeaway isn't to find the one "perfect" method but to cultivate a versatile estimation toolkit. The most mature and effective agile teams don't rigidly adhere to a single practice; they adapt their approach to fit the context, complexity, and stage of the project.
Estimation is not about creating a crystal ball to predict the future with unerring accuracy. Instead, its primary function is to foster communication, align understanding, and create a shared, realistic forecast. It's a diagnostic tool, not a contractual obligation. When your team debates whether a user story is a 5 or an 8 in Story Points, the value isn't in the final number. It's in the conversation that uncovers hidden assumptions, missed requirements, and potential roadblocks.
Synthesizing the Techniques for Maximum Impact
The true power of these methods is realized when they are combined strategically throughout the project lifecycle. Think of it as moving from a wide-angle lens to a microscope.
High-Level Roadmapping & Initial Discovery: For early-stage planning or large-scale initiatives, absolute precision is impossible and unnecessary. Techniques like T-Shirt Sizing and the Bucket System are ideal here. They help stakeholders and teams quickly group large epics or features into relative complexity buckets (S, M, L, XL), facilitating long-term planning without getting bogged down in minutiae.
Backlog Refinement & Grooming: As you prepare for upcoming sprints, the focus sharpens. For grooming a large, unsorted backlog, Affinity Estimation is incredibly efficient. It allows the team to silently and rapidly group dozens of stories by relative size, making a daunting task manageable. Dot Voting can then be used to prioritize which of these newly-sized items deserve more detailed attention first.
Sprint Planning & Detailed Estimation: This is where precision becomes more critical. Planning Poker shines in this context, leveraging the collective wisdom of the team to arrive at a consensus for individual stories. For particularly high-risk or uncertain tasks, supplementing this with a Three-Point Estimation (PERT) can provide a valuable risk-adjusted forecast by considering best-case, worst-case, and most-likely scenarios.
Moving Beyond the Estimate: Actionable Next Steps
Mastering agile estimation techniques is the first step; turning those estimates into predictable delivery is the goal. Here’s how to put this knowledge into practice:
- Start Small and Experiment: Don't try to implement five new techniques at once. Pick one that addresses a current pain point. If your backlog grooming sessions are chaotic, introduce Affinity Estimation. If sprint planning feels like a guessing game, formalize your use of Planning Poker.
- Establish a Baseline: Whichever relative sizing method you choose (like Story Points), track your team's velocity (the number of points completed per sprint). This historical data is your most powerful tool for future forecasting. Without it, your estimates remain educated guesses.
- Inspect and Adapt: Treat your estimation process as part of your agile feedback loop. Use your sprint retrospectives to discuss what worked and what didn’t. Was a particular estimate wildly inaccurate? Why? Was a technique causing more confusion than clarity? Be prepared to pivot.
- Decouple Estimation from Commitment: A crucial cultural shift is to separate the estimate from the commitment. An estimate is a forecast based on the information available at the time. A commitment is what the team believes it can deliver in a sprint. This distinction reduces pressure and encourages more honest, accurate estimations.
Ultimately, the goal is to transform estimation from a dreaded chore into a strategic advantage. It’s about building a shared understanding, managing expectations transparently, and empowering your team to deliver value reliably. By selecting the right tool for the job and continuously refining your process, you move from simply guessing at timelines to confidently navigating the complexities of modern development. This mastery is what separates good teams from great ones, turning abstract plans into tangible, successful outcomes.