Top 12 User Behavior Analytics Tools for In-Depth Insights in 2026
In the competitive digital marketplace, understanding the 'why' behind user actions is the difference between a product that stagnates and one that scales. While traditional analytics tell you what happened, user behavior analytics tools reveal how and why it happened. They are the key to unlocking deeper insights into user journeys, identifying friction points, and validating product decisions with real data, not assumptions. Making the right choice directly impacts your ability to improve user experience, boost retention, and drive revenue. The insights gained from these platforms are invaluable for implementing effective conversion rate optimization best practices and making data-informed product enhancements.
This guide moves beyond marketing claims to provide a detailed, practical comparison of the top 12 tools on the market. We'll analyze their core strengths, ideal use cases, pricing models, and implementation nuances, helping you select the perfect solution to transform user actions into actionable business intelligence. Whether you are a startup founder, a product manager at an SME, or a CTO in a large enterprise, this resource is designed to help you find the right tool for your specific needs.
We've done the heavy lifting so you can make a confident decision. Each tool profile includes a concise summary, key features, and direct links to get you started quickly. We will dive into a curated list featuring platforms like Amplitude, Mixpanel, Hotjar, and FullStory, breaking down what makes each one unique. Our goal is to equip you with the knowledge to move from guessing about user intent to knowing exactly what your customers need and how to deliver it.
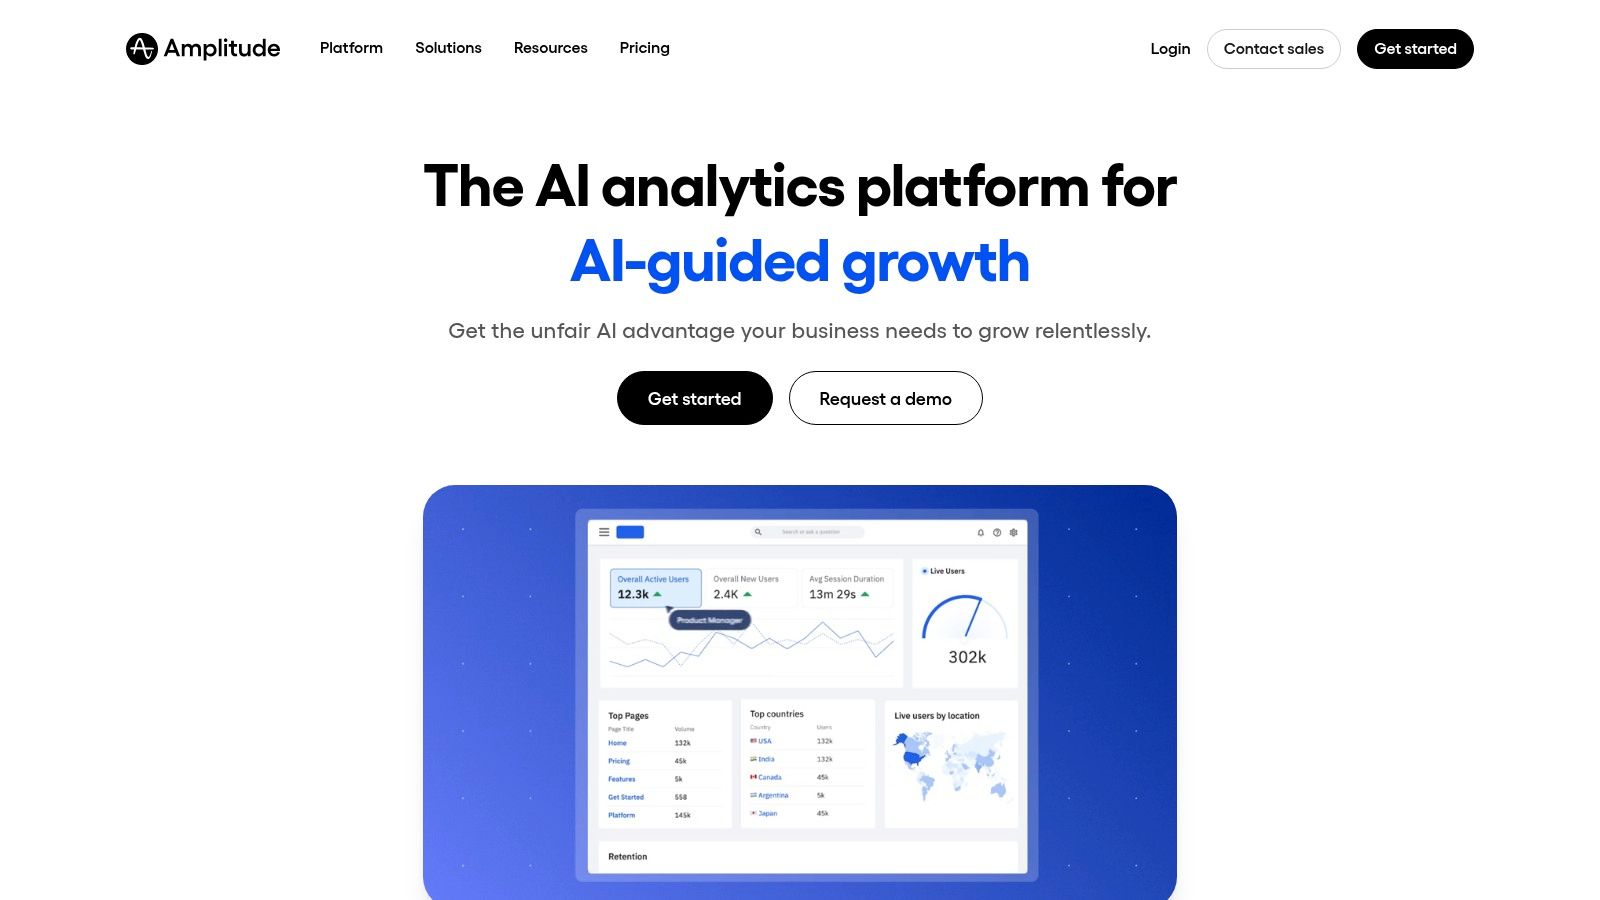
1. Amplitude
Amplitude is a comprehensive product analytics platform that has become a go-to for product-led growth (PLG) companies. It moves beyond simple web analytics, providing deep insights into how users interact with digital products. Teams can build behavioral cohorts, map user journeys, and analyze conversion funnels to pinpoint exactly where users drop off or find value. This makes it one of the most powerful user behavior analytics tools for teams aiming to optimize their product based on actual user actions, not just page views.
Its primary strength lies in its self-serve model and transparent pricing, which empowers startups and SMBs to access enterprise-grade analytics without a lengthy sales process. The platform's interface is designed for product managers and marketers, enabling them to answer complex questions without needing to write SQL queries.
Key Features & Pricing
Amplitude's feature set is built to support the entire product development lifecycle, from analysis to experimentation.
- Behavioral Analysis: Create granular user segments and cohorts based on actions taken within your app.
- Funnels & Journeys: Visualize multi-step user paths to understand conversion and retention drivers.
- Experimentation: A/B testing and feature flags are integrated directly into the analytics suite.
- Session Replay: Available on self-serve tiers to connect quantitative data with qualitative insights.
Pricing is transparent and based on monthly tracked users (MTUs), which aligns costs with active user growth. The Free Starter plan is generous, offering up to 50,000 MTUs, while the Plus plan starts at $49/month, making it highly accessible. Understanding which actions to track is critical for success; you can learn more about key user experience metrics to monitor.
Pros and Cons
| Pros | Cons |
|---|---|
| Transparent MTU-based pricing | Advanced features require higher-tier plans |
| Powerful self-serve capabilities | Can be complex to set up without a clear tracking plan |
| Strong community & learning resources | Data retention limits vary significantly by pricing tier |
| Generous free plan for startups | Enterprise needs will likely require a custom sales plan |
Best for: Product-led startups and SMBs that need a scalable, self-serve analytics tool to drive growth and retention.
Website: https://www.amplitude.com
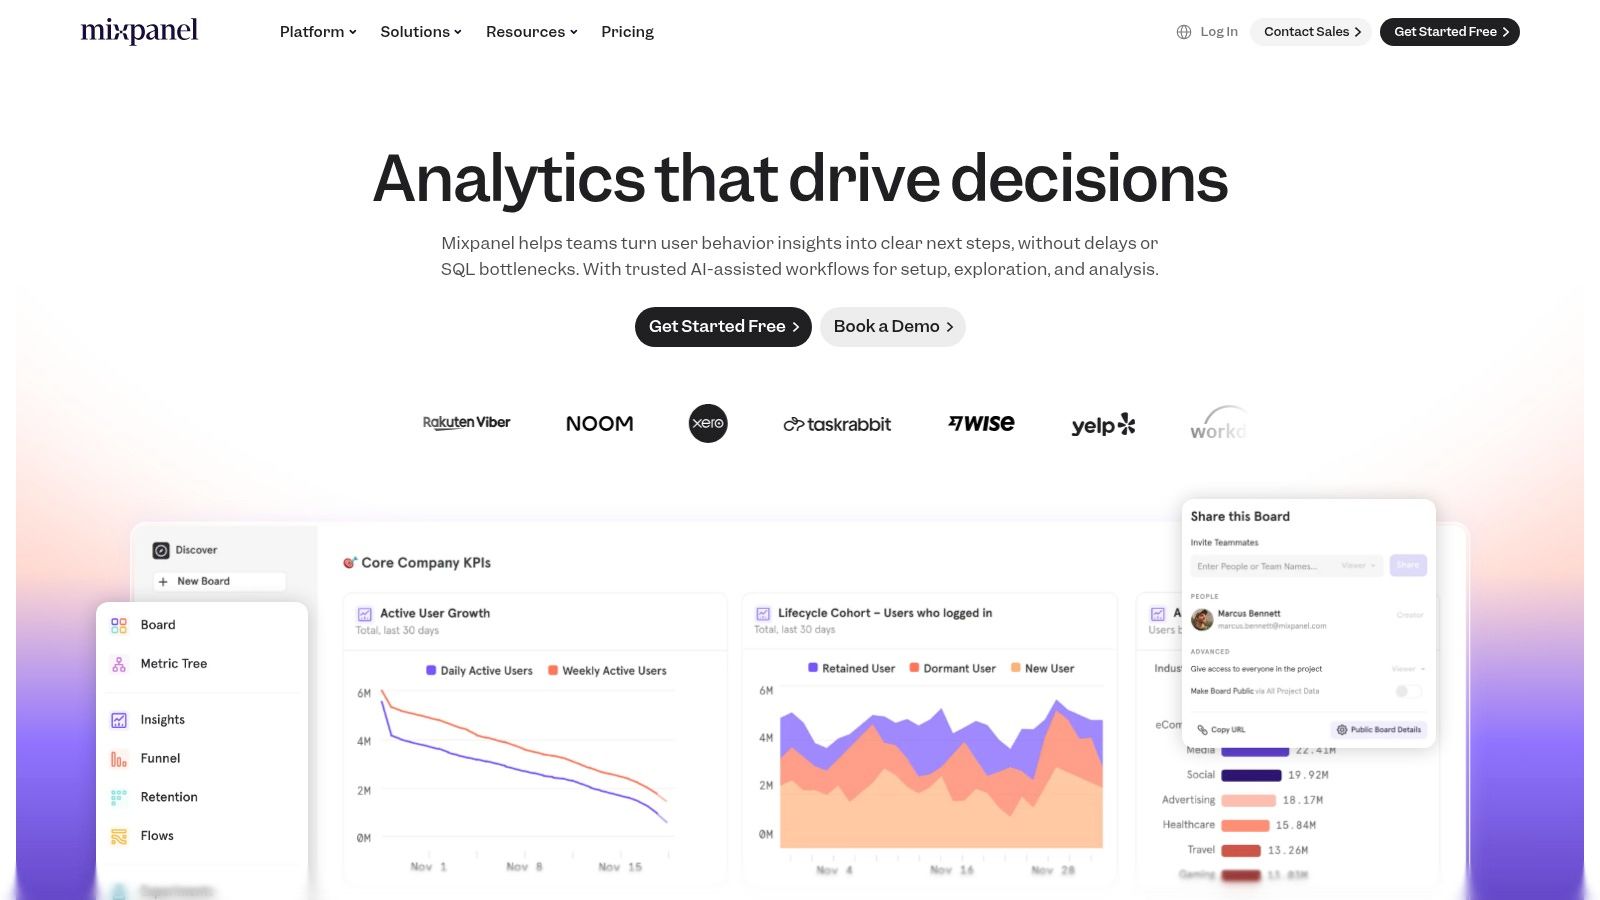
2. Mixpanel
Mixpanel is an event-based product analytics platform renowned for its powerful funnel analysis, retention tracking, and user flow visualization. It enables product teams to move beyond surface-level metrics and understand the "why" behind user actions. By focusing on specific events, Mixpanel helps pinpoint friction points in the user journey and identify features that drive long-term engagement, making it one of the most effective user behavior analytics tools for optimizing conversion and retention.
Its key differentiator is a clear, self-serve model with event-based pricing that is easy to understand and purchase online. The platform strikes a great balance between analytical depth and ease of use, empowering teams to answer complex questions about user behavior without needing extensive data science resources.
Key Features & Pricing
Mixpanel’s features are designed to provide a holistic view of the user lifecycle, from initial acquisition to long-term retention.
- Event-Based Analytics: Deeply analyze user behavior through funnels, retention cohorts, and custom user flows.
- Built-in Session Replay: Connect quantitative event data with qualitative session replays to see how users interact with your product.
- Data Integrations: Easily sync data with a wide range of marketing, A/B testing, and data warehouse tools.
- Impact Analysis: Measure the direct impact of new feature launches on key business metrics.
Pricing is transparent and usage-based. The Free plan is generous, offering up to 1 million monthly events and 10,000 monthly session replays. The Growth plan scales with usage, starting at around $0.28 per 1,000 events after the free tier, making it predictable and accessible.
Pros and Cons
| Pros | Cons |
|---|---|
| Clear usage-based calculator & buy flow | Event-based billing can be unpredictable at very high volumes |
| Good balance of ease-of-use and depth | Governance features are gated to the Enterprise tier |
| Session replay included in all plans | Initial setup requires a well-defined event tracking plan |
| Powerful data segmentation tools | May be overly complex for teams needing simple web analytics |
Best for: Product and marketing teams in SMBs and startups who need a powerful, self-serve tool with integrated session replays to improve user conversion and retention.
Website: https://mixpanel.com
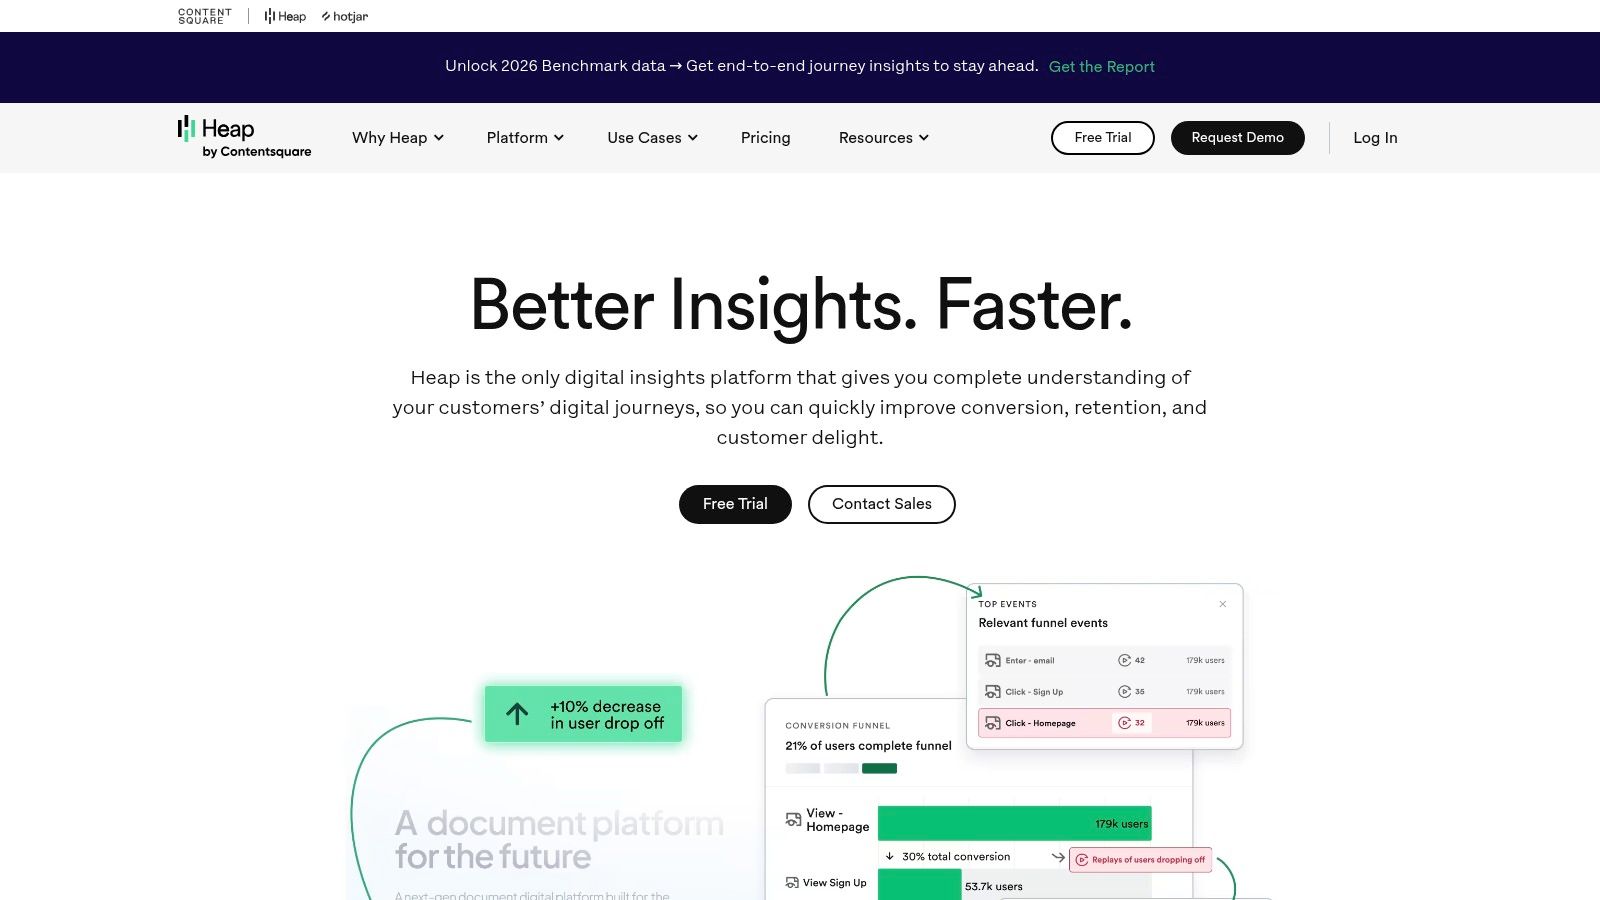
3. Heap (by Contentsquare)
Heap, now part of Contentsquare, distinguishes itself with a powerful "autocapture" technology. Instead of manually tagging events you think you'll need, Heap automatically captures every click, tap, swipe, and form submission on your site or app. This allows teams to perform retroactive analysis, asking questions about user behavior without needing prior setup. It’s one of the most agile user behavior analytics tools for teams that need to move fast and uncover insights they didn't anticipate.
The platform's primary advantage is its speed to value. With autocapture, you can analyze new funnels or user segments on-demand, without waiting for developers to implement new tracking code. This approach empowers product, marketing, and data teams to be more self-sufficient and responsive to business needs.
Key Features & Pricing
Heap’s feature set is designed for comprehensive, retroactive analysis and data governance.
- Autocapture: Automatically captures all user interactions, enabling retroactive analysis without manual tagging.
- Visual Labeling: A no-code visual data dictionary lets you define and manage events directly from your product's UI.
- Session Replay & Heatmaps: Available as an "Experience Analytics" add-on to connect quantitative data with qualitative insights.
- Data Warehouse Integrations: Seamlessly syncs your complete behavioral dataset with warehouses like Snowflake, BigQuery, and Redshift.
Heap offers a free plan for up to 10,000 monthly sessions. Paid plans (Growth, Pro, Premier) are quote-based, and pricing is customized through a sales-led process, which is common for enterprise-focused tools.
Pros and Cons
| Pros | Cons |
|---|---|
| Fast time-to-value via autocapture | Public pricing is sales-led; costs vary by contract |
| Retroactive analysis eliminates missed data | Best capabilities (e.g., Experience Analytics) are paid add-ons |
| Enterprise-grade governance & security | Can feel overwhelming without a clear analysis strategy |
| Strong data warehouse integrations | Requires careful data governance to manage noise |
Best for: Data-driven teams and enterprises that need a complete, retroactive dataset and prioritize speed to insight and strong governance.
Website: https://www.heap.io
4. Hotjar
Hotjar is an experience analytics platform that combines qualitative and quantitative data to reveal user behavior. It's particularly popular among marketing, UX, and CRO teams for its ability to visualize how users interact with a website through heatmaps, session recordings, and conversion funnels. This focus makes it one of the most approachable user behavior analytics tools for teams who want to quickly identify and fix usability issues without a steep learning curve.
Its primary strength is its all-in-one approach, blending visual behavior analysis with direct user feedback through integrated surveys and feedback widgets. This combination allows teams to not only see what users are doing but also understand the why behind their actions, providing a holistic view of the user experience.
Key Features & Pricing
Hotjar's features are organized into modular product suites, allowing teams to choose the tools they need most.
- Heatmaps & Session Replay: Visualize clicks, moves, and scrolls, and watch recordings of real user sessions.
- Funnels & Dashboards: Track key user flows and monitor core metrics from a central dashboard.
- Surveys & Feedback: Collect direct "Voice of the Customer" (VoC) data with on-site surveys and feedback widgets.
Pricing is modular, with separate plans for its "Observe" (heatmaps, recordings) and "Ask" (surveys, feedback) tools. A Free Basic plan is available for both, while paid plans like Plus and Business scale with the number of sessions or responses. For those looking to translate these insights into tangible improvements, you can explore strategies on how to increase website conversions effectively. Beyond session recordings, for visual insights into user interactions on specific elements, consider exploring the best heatmap tools available to pinpoint areas of interest and friction.
Pros and Cons
| Pros | Cons |
|---|---|
| Very quick implementation & approachable UI | Sampling rules on lower tiers can limit deep analysis |
| Integrated VoC and visual analytics tools | Complex pricing if multiple product suites are needed |
| Great for non-technical marketing/UX teams | Less focused on deep product analytics than competitors |
| Strong free plans to get started quickly | Data retention is limited on entry-level plans |
Best for: Marketing, UX, and product teams that need an easy-to-use, all-in-one tool for visualizing user behavior and collecting direct feedback to improve website usability and conversion rates.
Website: https://www.hotjar.com
5. FullStory
FullStory is a digital experience intelligence platform that excels at providing the "why" behind user actions. It automatically captures every user interaction on your website or app, allowing teams to replay sessions with pixel-perfect accuracy. This autocapture capability eliminates the need for manual event tracking for session replays, making it one of the most comprehensive user behavior analytics tools for teams that need immediate, retroactive insights into user struggles and rage clicks.
Its primary strength is connecting quantitative data (like conversion funnels and user journeys) with high-fidelity qualitative data from session replays. This empowers product, support, and engineering teams to debug issues, validate product decisions, and understand the complete customer experience without guesswork. The platform also emphasizes privacy with robust masking and policy controls.
Key Features & Pricing
FullStory’s feature set is designed to provide a complete, context-rich view of the digital experience.
- Autocapture & Session Replay: Captures all user interactions, providing high-quality session replays for deep analysis.
- Journeys & Funnels: Visualize user paths and identify drop-off points with integrated analytics.
- AI-led Insights (StoryAI): Automatically surfaces user frustrations and opportunities for improvement.
- Privacy Controls: Granular tools for masking and unmasking sensitive user data.
Pricing is session-based, with a generous FullstoryFree plan offering 30,000 monthly sessions and 12 months of data retention, ideal for startups. For higher volumes and advanced features, you'll need to engage with their sales team for a custom plan. These insights are invaluable when planning your product roadmap, a key part of how to conduct user research effectively.
Pros and Cons
| Pros | Cons |
|---|---|
| Excellent session replay quality & error context | Advanced features require sales engagement and custom plans |
| Autocapture provides retroactive insights | Overages and quotas need active management at scale |
| Generous free tier for evaluation and startups | Can be more expensive than competitors for high volumes |
| Strong privacy and data masking controls | Initial setup can feel overwhelming without clear goals |
Best for: Product, support, and engineering teams in SMBs and enterprises that need high-fidelity session replay to debug issues and understand the complete customer journey.
Website: https://www.fullstory.com
6. Contentsquare
Contentsquare is an enterprise-grade digital experience analytics (DXA) platform that provides a holistic view of the customer journey. It excels at identifying user friction and uncovering optimization opportunities by combining quantitative and qualitative data. This makes it one of the most powerful user behavior analytics tools for large e-commerce sites and enterprises focused on perfecting their digital experience and boosting conversion rates through deep, contextual insights.
Its primary strength is its comprehensive feature set, which includes advanced visualizations and AI-driven recommendations. The platform is designed for UX, marketing, and product teams to collaborate on improving the entire digital customer experience, from initial landing to final conversion, by understanding the "why" behind user actions.
Key Features & Pricing
Contentsquare offers a robust suite of tools designed to analyze and optimize every aspect of the user journey.
- Zone-Based Heatmaps: Goes beyond clicks to show scroll depth, exposure, and engagement with specific page elements.
- Session Replay & Journey Analysis: Visualizes complete user sessions and maps out complex customer paths to identify friction points.
- Voice of Customer: Higher-tier plans integrate feedback and survey capabilities to merge qualitative sentiment with quantitative data.
- AI Insights: Automatically surfaces high-impact opportunities and anomalies in user behavior.
Pricing starts with a generous Free-forever plan, offering up to 200,000 monthly sessions and 10,000 replays, making it highly accessible. Enterprise and advanced features require custom pricing plans tailored to specific business needs.
Pros and Cons
| Pros | Cons |
|---|---|
| One of the most capable free plans available | Advanced capabilities require custom-priced enterprise plans |
| Strong path and friction analysis for e-commerce | Implementation can be heavier for very large sites or apps |
| Combines quantitative and qualitative data effectively | May be overly complex for very small teams or simple sites |
| AI-powered insights surface opportunities automatically | The full value is unlocked in higher-tier, paid packages |
Best for: Enterprises and large e-commerce businesses that need a comprehensive DXA platform to identify and eliminate user friction at scale.
Website: https://contentsquare.com
7. Pendo
Pendo is a product experience platform that uniquely combines user behavior analytics with in-app guidance and feedback collection. While many tools focus solely on data analysis, Pendo allows teams to act on those insights directly within the same platform by deploying guides, polls, and walkthroughs. This integrated approach makes it one of the most effective user behavior analytics tools for B2B SaaS companies focused on improving user onboarding, feature adoption, and retention.
The platform’s power lies in its codeless installation and ability to retroactively analyze data, meaning teams don't lose historical insights if they decide to track a new event. It empowers product managers to not only understand what users are doing but also to directly influence their behavior to drive better outcomes without needing engineering resources for every change.
Key Features & Pricing
Pendo's feature set is designed to close the loop between insight, action, and feedback.
- Product Analytics: Track user paths, feature usage, and retention cohorts to identify trends.
- In-app Guides: Deploy targeted guides, tooltips, and announcements to drive adoption.
- Feedback & NPS: Collect qualitative user feedback and measure Net Promoter Score in-app.
- Session Replay: Available on certain plans to connect quantitative data with visual context.
Pricing for paid tiers is not public and requires a custom quote, which can be a significant investment. However, Pendo Free offers a strong starting point with analytics, guides, and NPS for up to 500 monthly active users (MAUs), making it ideal for early-stage evaluation.
Pros and Cons
| Pros | Cons |
|---|---|
| All-in-one analytics & in-app guidance | Public pricing for paid tiers is not available |
| Codeless installation & retroactive data | Enterprise quotes can be high and complex |
| Strong focus on product adoption | Many advanced features are add-ons on lower-tier plans |
| Free plan for early-stage evaluation | Can feel less specialized than dedicated analytics tools |
Best for: B2B SaaS companies that need an integrated solution to both analyze user behavior and actively guide users to improve onboarding and feature adoption.
Website: https://www.pendo.io
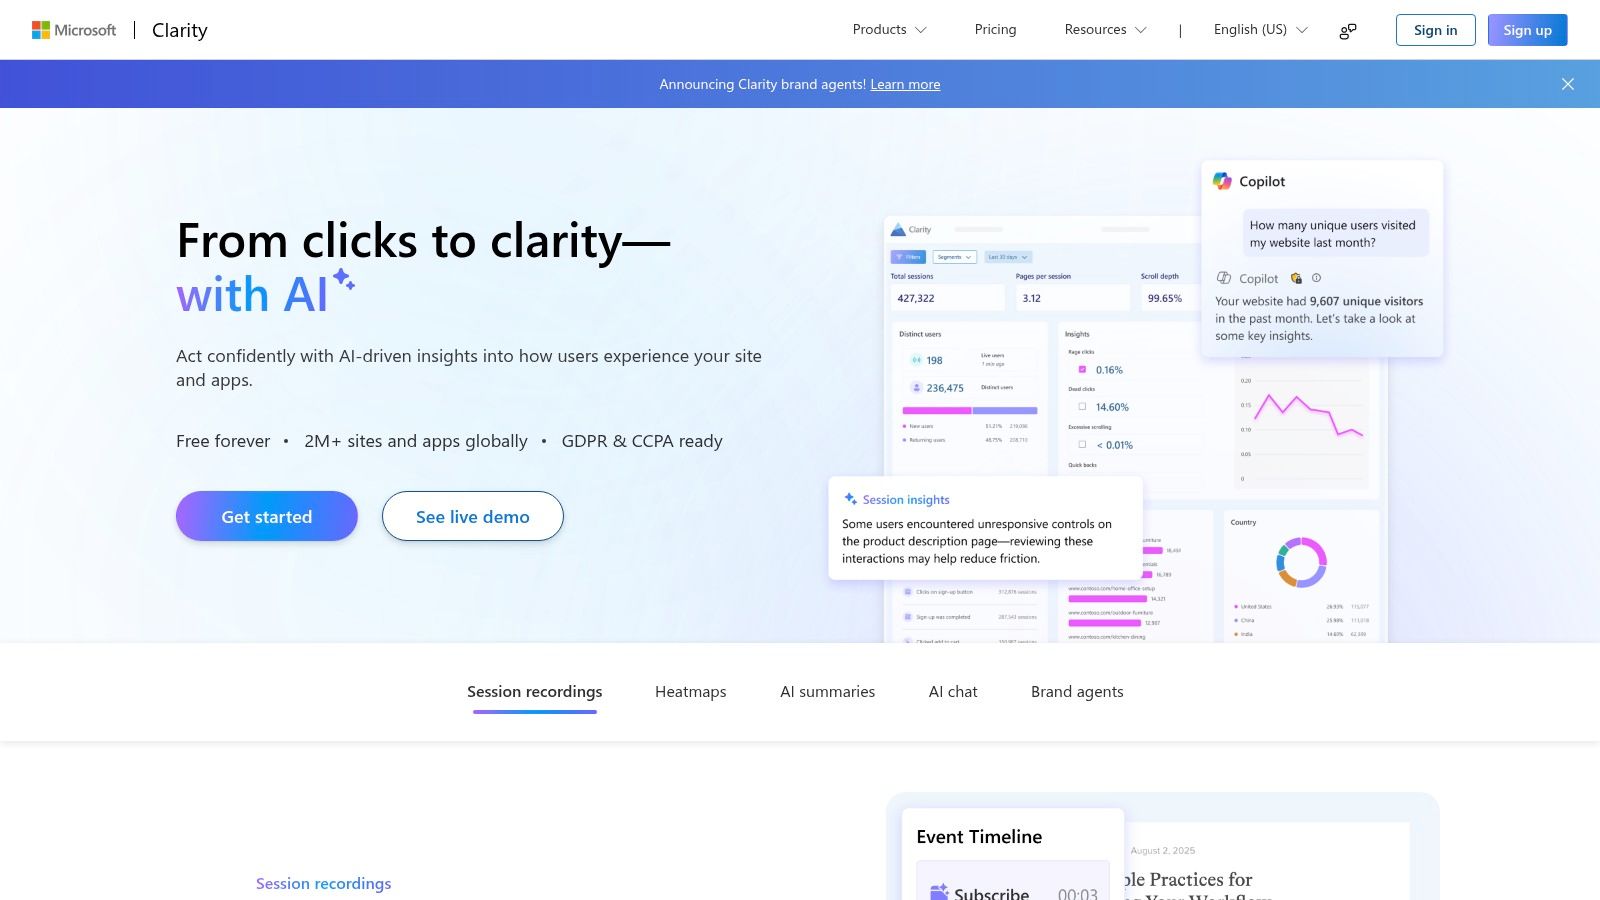
8. Microsoft Clarity
Microsoft Clarity is a completely free, privacy-focused analytics tool that demystifies how users interact with your website through visual data. It specializes in session recordings and heatmaps, offering a qualitative lens to complement quantitative data from other tools. For teams focused on UX debugging and conversion rate optimization (CRO), Clarity provides an invaluable, no-cost entry point into the world of user behavior analytics tools. Its lightweight script ensures minimal impact on site performance.
The platform's standout feature is its simplicity and zero-cost model, making it an accessible choice for businesses of all sizes, from bloggers to large e-commerce sites. By automatically identifying user friction signals like "rage clicks" and "dead clicks," it helps teams quickly pinpoint and resolve usability issues without sifting through hours of footage. This focus on immediate, actionable insights makes it a powerful addition to any analytics stack.
Key Features & Pricing
Clarity’s feature set is streamlined to provide core visual behavior insights without complexity or cost.
- Session Recordings & Heatmaps: Watch real user sessions and see aggregated click, move, and scroll maps.
- Automated Insights: Automatically detects rage clicks, dead clicks, and excessive scrolling to flag frustration.
- Google Analytics Integration: Connects session replays directly to your GA data for deeper context.
- No Traffic Limits: Clarity is always free with no caps on traffic, sessions, or heatmaps.
Pricing is straightforward: it's completely free. There are no paid tiers, hidden costs, or data sampling, which is a significant differentiator in the market. Its official plugins for platforms like WordPress and Shopify ensure a quick, code-free setup.
Pros and Cons
| Pros | Cons |
|---|---|
| Completely free with no traffic limits | Lacks advanced product analytics features |
| Minimal impact on website performance | No built-in A/B testing or experimentation tools |
| Excellent for UX debugging & CRO | Does not support advanced cohort or funnel analysis |
| Fast deployment & easy to use | Better as a supplemental tool than a standalone solution |
Best for: Teams of any size needing a simple, free tool for session replays and heatmaps to identify and fix website usability issues.
Website: https://clarity.microsoft.com
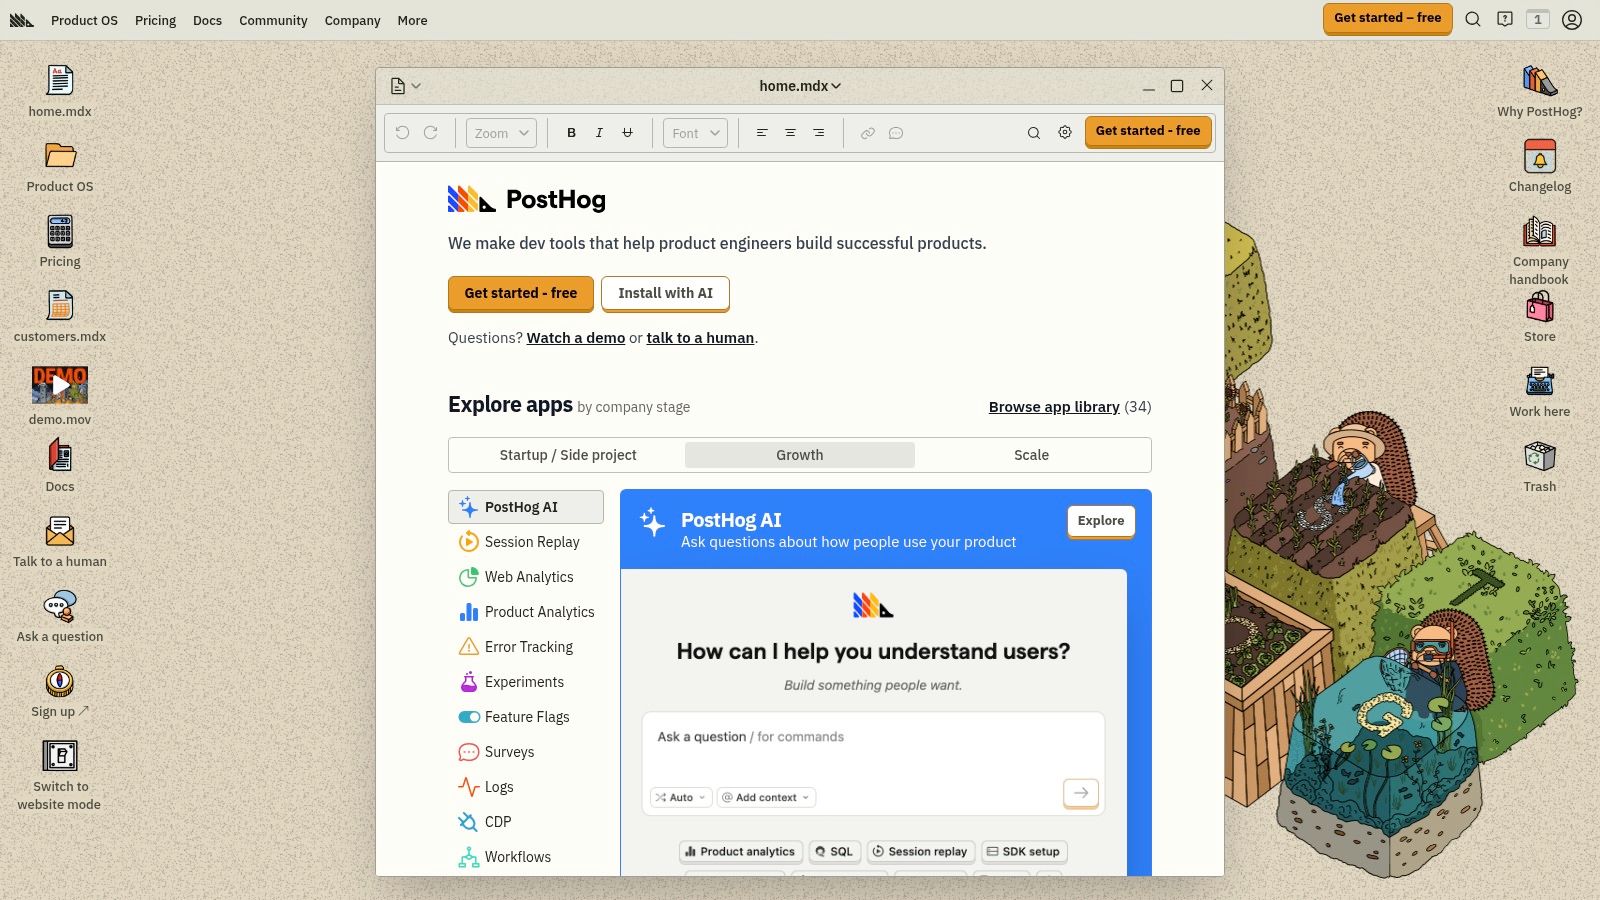
9. PostHog
PostHog is an open-core, all-in-one product analytics suite designed for developers and teams seeking maximum data control. It uniquely combines product analytics, session replay, feature flags, A/B testing, and surveys into a single platform. This integrated approach allows teams to move quickly from identifying a user behavior trend to testing a hypothesis without switching tools, making it one of the most versatile user behavior analytics tools available.
Its key differentiator is its deployment flexibility; you can use their cloud version or self-host the entire platform for complete control over your data. This makes it an ideal choice for companies in regulated industries or those with strict data privacy and residency requirements, offering a level of transparency that most SaaS-only tools cannot match.
Key Features & Pricing
PostHog’s pricing is built on a transparent, usage-based model with generous free tiers for each of its core products.
- Product Analytics: Autocapture events with a single snippet, offering instant insights without manual tracking setup.
- Session Replay: Connect quantitative data points directly to qualitative user session recordings.
- Feature Flags & A/B Testing: Roll out new features safely and run experiments to validate their impact.
- Surveys & Data Warehouse Sync: Collect direct user feedback within your app and sync all data to your own warehouse.
The platform offers a generous free plan that includes 1 million events, 5,000 session replays, and 1 million feature flag requests per month. Beyond that, pricing is pay-as-you-go, allowing you to scale costs predictably as your user base grows.
Pros and Cons
| Pros | Cons |
|---|---|
| Transparent pricing with large free quotas | Multiple product meters to track as usage grows |
| Self-hosting option for data control | Advanced SLAs require higher-tier plans |
| All-in-one suite reduces tool fragmentation | Self-hosting requires technical maintenance resources |
| Developer-friendly with open-core model | Might be overly complex for non-technical marketing teams |
Best for: Startups and scale-ups that need a flexible, developer-centric analytics suite with the option for complete data ownership via self-hosting.
Website: https://posthog.com
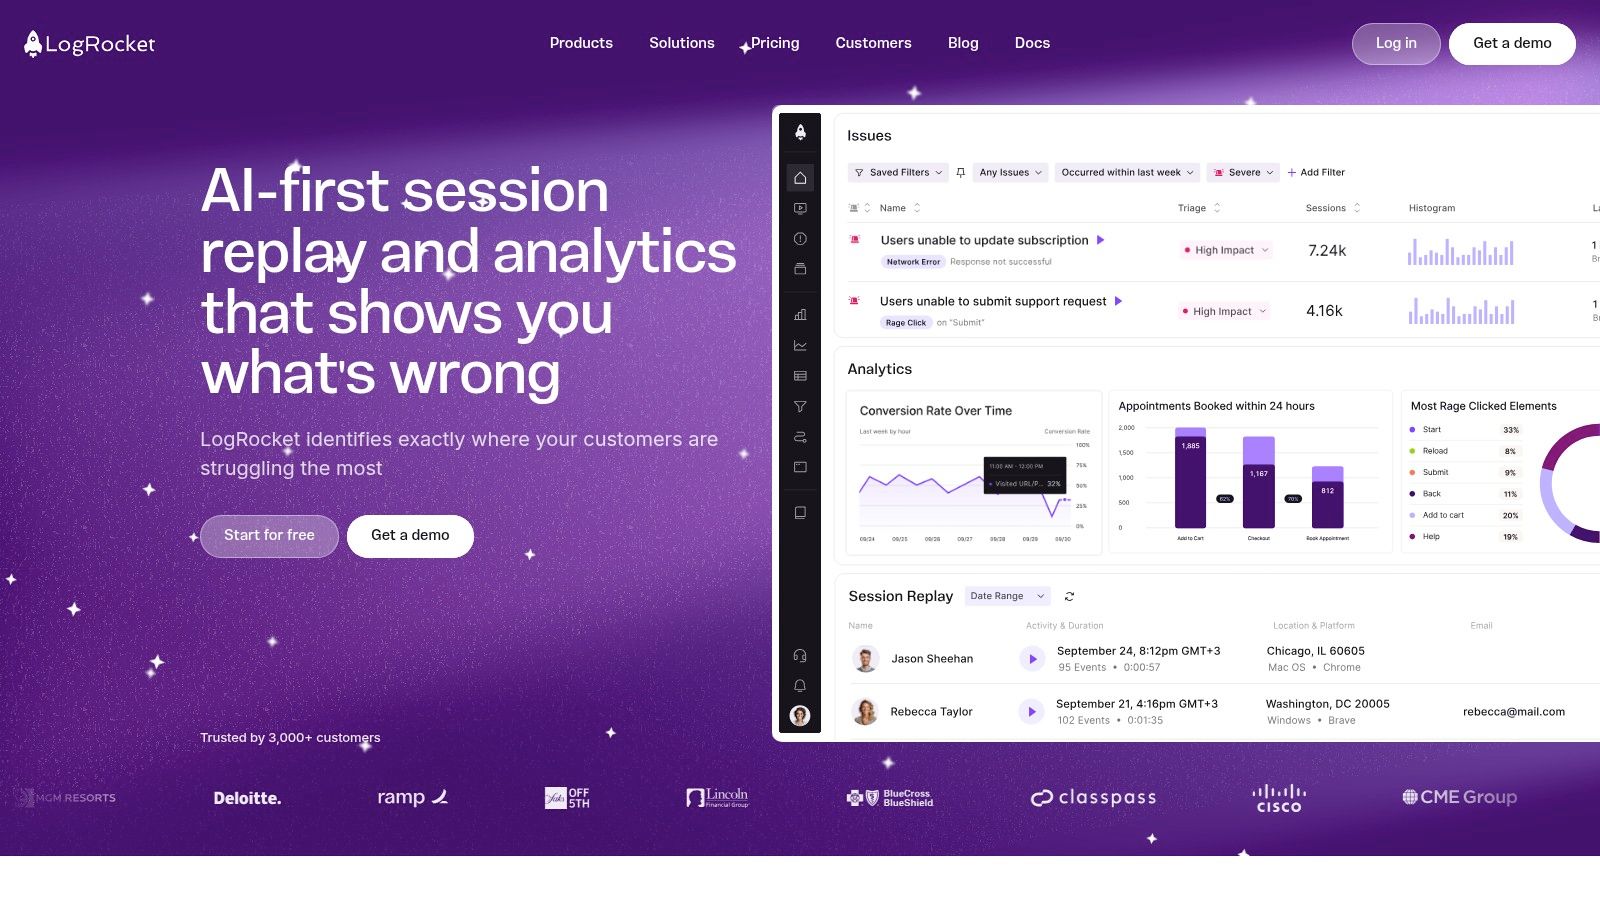
10. LogRocket
LogRocket bridges the gap between user behavior analytics and technical performance monitoring, making it a favorite among engineering and product teams. It combines high-fidelity session replay with detailed error tracking and performance data, allowing teams to see not just what a user did, but also the technical context behind their experience. This makes it one of the most effective user behavior analytics tools for diagnosing bugs, network issues, and performance bottlenecks that frustrate users.
Its core strength is in providing a complete picture of the user session, capturing console logs, network requests, and performance metrics alongside the visual recording. This diagnostic depth helps teams quickly reproduce and resolve issues that would otherwise be difficult to track down, turning qualitative user feedback into actionable engineering tasks.
Key Features & Pricing
LogRocket’s feature set is designed for deep technical and user experience diagnosis on both web and mobile platforms.
- Session Replay with Developer Tools: Watch user sessions with access to the console, network activity, and performance data from that specific session.
- Error Tracking & Performance Monitoring: Automatically captures JavaScript errors and frontend performance metrics, linking them directly to user replays.
- AI-Powered Issue Detection: Its AI, Galileo, proactively surfaces UX frustrations and technical issues without manual analysis.
- Product Analytics: Includes heatmaps, funnels, and path analysis to understand user behavior at an aggregate level.
Pricing starts with a Free plan offering 1,000 sessions per month. The Team plan begins at $69/month, providing more sessions and longer data retention, making it accessible for growing teams.
Pros and Cons
| Pros | Cons |
|---|---|
| Combines qualitative and quantitative data | Lower-tier plans have restrictive session and data limits |
| Deep diagnostic tools for developers | Can be resource-intensive on some client-side devices |
| Proactive AI-driven issue surfacing | Advanced analytics features are reserved for higher plans |
| Supports both web and native mobile apps | Can feel overly technical for non-engineering users |
Best for: Engineering-led product teams that need to connect user behavior with technical performance to quickly identify and fix bugs and UX issues.
Website: https://logrocket.com
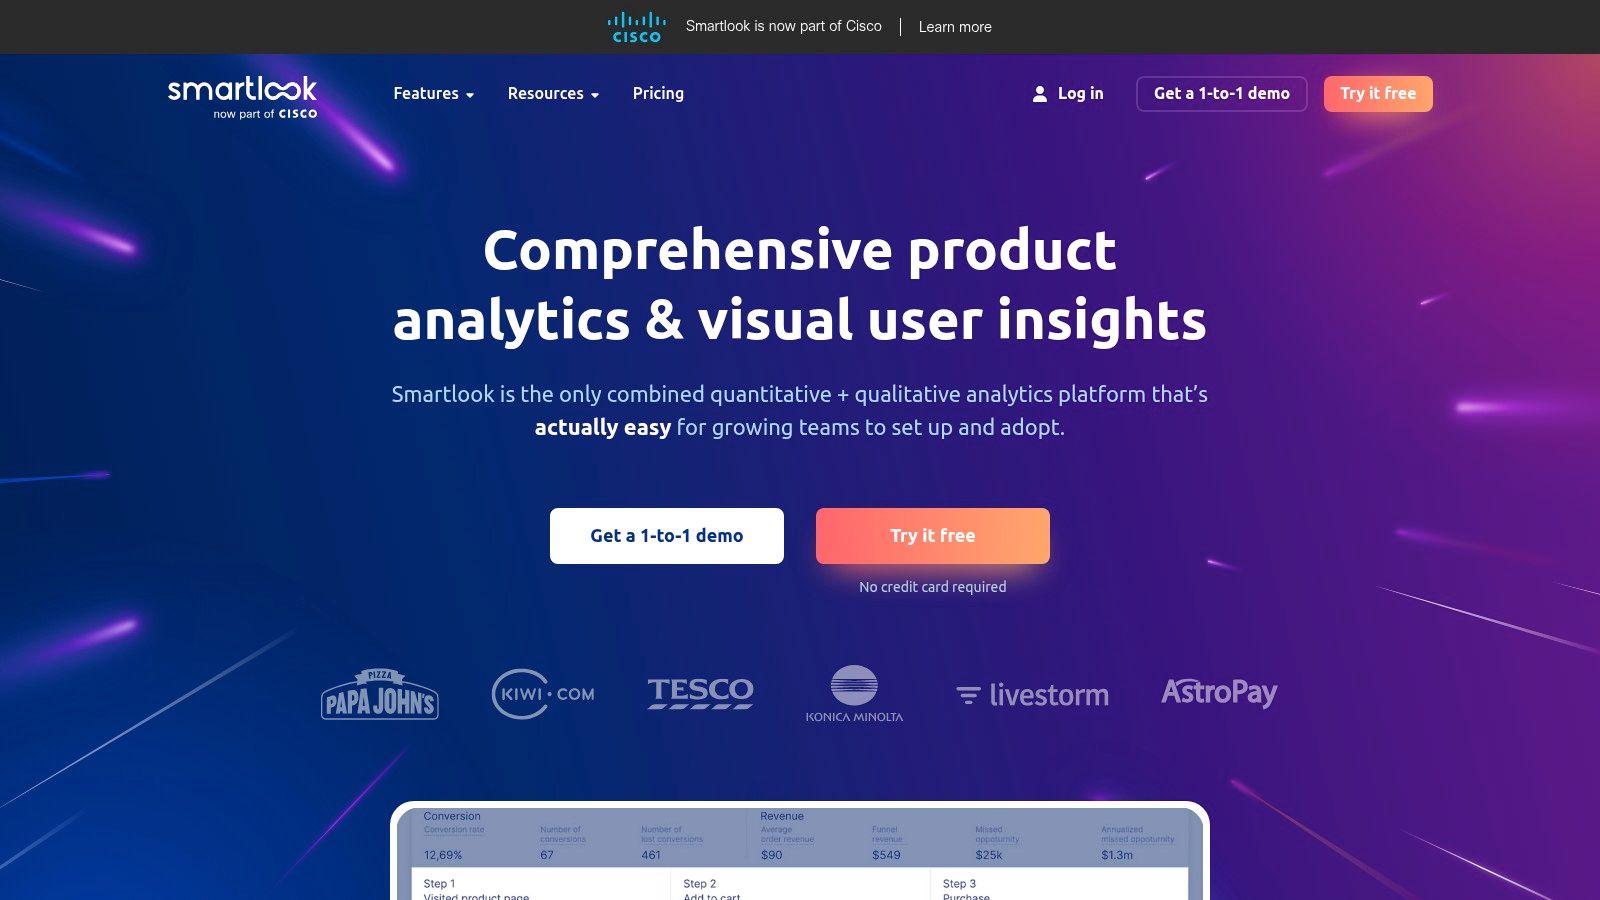
11. Smartlook
Smartlook uniquely combines qualitative and quantitative analytics, offering a unified platform for web and mobile applications. It bridges the gap between seeing what users do (through events and funnels) and understanding why they do it (through session replays and heatmaps). This integrated approach makes it one of the more versatile user behavior analytics tools for teams that need to diagnose issues quickly without juggling multiple platforms.
Its key differentiator is its robust cross-platform SDK support, which extends its powerful analytics capabilities beyond websites to native iOS, Android, and even gaming engine applications like Unity. This allows product teams to maintain a consistent view of user behavior across their entire digital ecosystem, from web funnels to in-app interactions.
Key Features & Pricing
Smartlook focuses on delivering actionable insights through a combination of visual and event-based data.
- Session Replay & Heatmaps: Watch user sessions and visualize clicks, moves, and scroll behavior to identify friction points.
- Events & Funnels: Automatically track user events or define custom ones to build conversion funnels and analyze drop-off rates.
- Cross-Platform SDKs: Deploy on web, iOS, Android, React Native, Flutter, and Unity for a comprehensive view.
- Anomaly Alerts: Get automatically notified of sudden drops in conversion rates or spikes in errors.
Pricing starts with a Free plan that typically includes up to 3,000 sessions/month. The Pro plan offers more sessions and features with transparent, session-based pricing. Note that Smartlook is a Cisco company, and some enterprise-level pricing inquiries may be routed accordingly.
Pros and Cons
| Pros | Cons |
|---|---|
| Combines qualitative & quantitative data | Data retention is limited on lower-tier plans |
| Easy setup and intuitive interface | Enterprise pricing can be complex due to Cisco ownership |
| Excellent mobile and cross-platform SDKs | The free plan's session limit is modest |
| SOC 2 Type II compliant | Anomaly detection is reserved for higher-tier plans |
Best for: Web and mobile-first companies that need a single tool to visualize user journeys and analyze conversion funnels across multiple platforms.
Website: https://www.smartlook.com
12. Mouseflow
Mouseflow is a comprehensive behavior analytics platform that excels at providing qualitative insights through session replay and heatmaps. It's designed for UX, marketing, and product teams who want to visualize user struggles and identify optimization opportunities without a steep learning curve. The platform bundles session recordings with funnels, form analytics, and user feedback widgets, making it one of the most well-rounded user behavior analytics tools for conversion rate optimization (CRO).
Its primary strength lies in its straightforward, self-serve model and a strong focus on privacy, including EU-based hosting options. This makes it a trusted choice for companies that need to balance deep user insights with strict data compliance. The platform automatically detects friction points like "rage clicks" and JavaScript errors, helping teams quickly prioritize fixes that improve the user experience.
Key Features & Pricing
Mouseflow offers an all-in-one suite to uncover usability issues and understand user intent.
- Session Replay & Heatmaps: Watch user sessions and visualize clicks, scrolls, and mouse movement.
- Conversion Funnels: Build funnels to see where users drop off in key conversion paths.
- Form Analytics: Analyze form engagement field-by-field to identify and fix submission barriers.
- Friction & Error Detection: Automatically tag sessions with usability issues for easy filtering and analysis.
Pricing is transparent and based on recorded sessions per month, starting with a generous Free forever plan. Paid plans like Essential and Advanced offer more recordings and data retention, and all paid tiers come with a 14-day full-feature trial.
Pros and Cons
| Pros | Cons |
|---|---|
| Broad feature set for CRO/UX teams | Very large sites may need custom plans and recording strategies |
| Clear, transparent pricing and a quick path to buy | Enterprise integrations and SSO require higher tiers |
| Minimal learning curve to get started | Can be resource-intensive on the browser for very complex sites |
| Strong focus on privacy with EU hosting | Funnel analysis is less advanced than product analytics tools |
Best for: UX and CRO teams in SMBs and mid-market companies that need a complete, easy-to-use toolkit for visualizing and fixing website friction points.
Website: https://mouseflow.com
Top 12 User Behavior Analytics Tools Comparison
| Product | Core features | Quality ★ | Price/Value 💰 | Audience 👥 | Standout ✨/🏆 |
|---|---|---|---|---|---|
| Amplitude | Cohorts, funnels, journeys, experimentation, replay | ★★★★ | 💰 Free Starter (50K MTU); Plus from $49; MTU-based | 👥 PLG & product teams | ✨ MTU pricing & strong learning resources |
| Mixpanel | Event-based funnels, retention, user flows, replay | ★★★★ | 💰 Free up to 1M events; pay-as-you-go ($0.28/1K post‑1M) | 👥 Growth/product teams | ✨ Clear online buy flow; built-in replay |
| Heap (Contentsquare) | Autocapture, retroactive analysis, warehouse sync | ★★★★ | 💰 Sales-led pricing; add-ons for Experience Analytics | 👥 Governance-sensitive & enterprise teams | ✨ Autocapture + retroactive insights; enterprise security |
| Hotjar | Heatmaps, funnels, session replay, VoC (surveys) | ★★★ | 💰 Free plan; Growth from $49; modular pricing | 👥 Marketing / UX / CRO teams | ✨ Fast setup & approachable VoC tooling |
| FullStory | Autocapture, high‑quality replay, journeys, StoryAI | ★★★★★ | 💰 Generous free tier (30K sessions); enterprise quotes | 👥 CX & product teams | 🏆 Best-in-class replay + AI insights & privacy controls |
| Contentsquare | DXA: heatmaps, replay, journey analysis, VoC | ★★★★ | 💰 Free-forever up to 200K sessions; enterprise tiers | 👥 Enterprise & e‑commerce UX teams | 🏆 Strong path/friction analysis for e‑commerce |
| Pendo | Product analytics + in-app guides, NPS, feedback | ★★★★ | 💰 Free up to 500 MAUs; paid by quote | 👥 B2B SaaS product & adoption teams | ✨ Analytics + in‑app guidance in one platform |
| Microsoft Clarity | Session recordings, heatmaps, rage/dead click detection | ★★★ | 💰 Always free (no traffic caps) | 👥 Small teams / fast UX debugging | ✨ Zero cost, quick deployment & CMS plugins |
| PostHog | Autocapture, flags, A/B testing, surveys, self‑host | ★★★★ | 💰 Generous free quotas; cloud or self‑host pay-as-you-go | 👥 Dev-first teams needing data control | 🏆 Self-hosting + transparent usage pricing |
| LogRocket | Replay + network logs, performance & error context, AI | ★★★★ | 💰 Free 1K sessions; team plans from $69/mo | 👥 Engineering & product diagnostics teams | ✨ Dev-oriented diagnostics tied to replay |
| Smartlook | Replay, heatmaps, events, funnels, cross‑platform SDKs | ★★★★ | 💰 Free (~3K sessions); Pro/Enterprise options | 👥 Cross-platform mobile & web teams | ✨ Strong mobile & game engine SDK support |
| Mouseflow | Replay, heatmaps, funnels, form analytics, journey mapping | ★★★ | 💰 Free & transparent self-serve plans; 14‑day trial | 👥 UX/CRO teams, EU‑focused orgs | ✨ Clear pricing + EU privacy options |
From Data to Decisions: Making Your Analytics Actionable
We've explored a comprehensive landscape of the best user behavior analytics tools available today, from the enterprise-grade power of Contentsquare and Amplitude to the startup-friendly accessibility of Microsoft Clarity and PostHog. The journey through session replays, heatmaps, funnel analysis, and cohort retention charts reveals a powerful truth: understanding why users act the way they do is no longer a mystery. The challenge now shifts from data collection to data activation.
Choosing the right platform is the foundational first step, but it is not the final destination. The true value of these tools is unlocked only when the insights they generate are systematically embedded into your product development, marketing, and overall business strategy. Simply observing user friction in a FullStory session replay or noting a drop-off point in a Mixpanel funnel is passive. The goal is to create a proactive, data-informed culture that consistently closes the loop between user behavior and business outcomes.
Recapping Your Options: The Right Tool for the Job
Your ideal tool depends entirely on your company's stage, budget, and primary objectives.
- For deep quantitative analysis and product intelligence, platforms like Amplitude, Mixpanel, and Heap are unparalleled. They are built for teams that need to answer complex questions about feature adoption, long-term retention, and user segmentation at scale.
- For rich qualitative insights and UX optimization, tools like Hotjar, FullStory, and Smartlook provide the visual context that numbers alone cannot. They help you build empathy by literally seeing your product through your users' eyes.
- For a free yet powerful starting point, Microsoft Clarity offers an incredible suite of features at no cost, making it an ideal choice for startups and small businesses testing the waters of behavioral analytics.
- For developers and technical teams seeking control and transparency, open-source solutions like PostHog or front-end monitoring specialists like LogRocket offer deep technical insights alongside classic analytics features.
Your Actionable Next Steps
Merely installing a script is not a strategy. To transform raw data into a competitive advantage, you need a clear plan. Start by defining what success looks like. Are you trying to improve a specific conversion funnel, reduce customer churn, or validate a new feature? Set clear, measurable goals before you even log into your analytics dashboard.
Combine the what with the why. Use quantitative data from your funnels and cohort analyses to identify problem areas at scale. Then, dive into the qualitative data from session replays and heatmaps for that specific user segment to understand the human frustration behind the numbers. This blended approach allows you to form strong, evidence-backed hypotheses for A/B testing and product improvements.
Finally, acknowledge the technical realities. The quality of your insights is directly proportional to the quality of your data implementation. A poorly configured event-tracking plan or a buggy integration can render your data useless, leading to flawed conclusions. This is where strategic resource allocation becomes critical. If your in-house team is stretched thin or lacks specialized expertise in data engineering and API integrations, the implementation can stall indefinitely.
This is a perfect scenario to consider a flexible, expert partnership. A nearshore development team like Nerdify can provide the dedicated technical horsepower to ensure your chosen user behavior analytics tools are implemented flawlessly. They can manage complex event tracking schemas, build custom integrations, and ensure your data pipelines are clean and reliable from day one. This allows your core team to focus on what they do best: analyzing the insights and making brilliant strategic decisions. The right tool, powered by the right strategy and executed with technical precision, will turn your user data from a confusing stream of information into your most valuable asset for sustainable, customer-centric growth.